To create the report to illustrate the IRP strategy, you first need to enter the product features of the chosen product based on the following:
-
Do not add any additional coverage, since it's not taken into account when comparing amounts in the report.This applies to the presentation and is not a constraint for selling additional coverage.
- It is recommended to choose the annual payment method.
Procedure to illustrate the Insured Retirement Plan:
- Click the
Sales Strategies tab of the illustration software.
- Open the
Concepts section.
- From the drop-down menu, select
Insured Retirement Plan in the
Affluent section.
- Click
Export to download the strategy. The data in the illustration will be transferred to a spreadsheet.
- Once your browser has finished downloading the spreadsheet, open it in the browser or from the Downloads folder. You'll have 60 minutes to open the file and access the data in the illustration. After that, you'll have to download the spreadsheet again.
- Enable macros and editing.

- This screen will appear for the selected product.
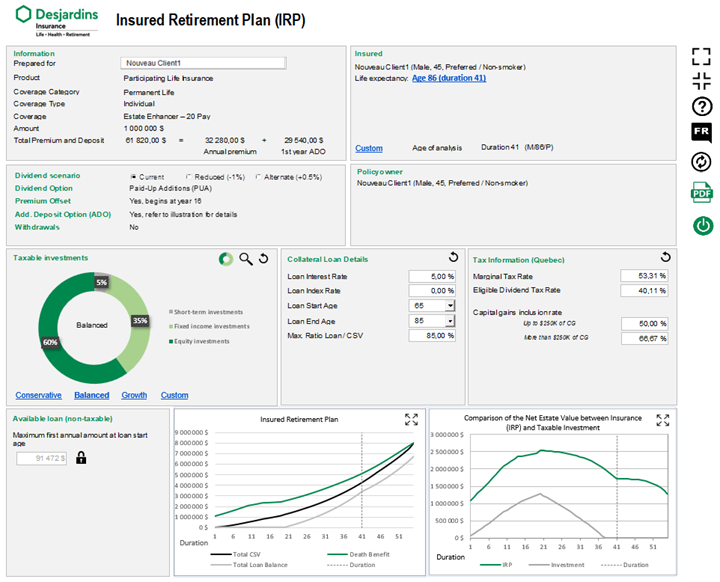
- Make sure the information about the proposed insured and the insurance coverage is correct. If it isn't, exit the page and restart the illustration.
- Confirm or change the name of the client the strategy is being prepared for.
- In the
Insureds section, select the period you want to analyze. Click the
Personalize link to select the life expectancy of one of the proposed insureds, the equivalent age or any other period. The time selected is indicated on the charts by a dotted vertical line.
- Create a hypothetical portfolio in the
Taxable Investment section, allocating to interest, dividend and capital gain income. The allocation must always add up to 100%. For each type of investment, choose a rate of return that's realistic and takes the current situation into account. This investment portfolio will be compared to the values of insurance policy. We assume that the amounts invested in both scenarios are the same. You can view the investment composition as a chart or a table, depending on your preference.
- In the
Collateral Loan Details section: Enter the loan interest rate, the annual indexation rate (if desired) and the start and end dates of the client’s payments. The maximum loan-to-cash value ratio is 85%. We do not recommend changing it.
- The tax rates shown are in the calculations
vary by province. These rates are updated and do not need to be changed.
- Once you've entered all the relevant information, the tool will calculate the maximum annual loan starting at the selected age. To reduce this amount, click the lock icon to unlock it. All the other parameters are set to match the initial assumptions. If you click the lock icon again, the initial maximum values will reappear, and the other variables can be changed as needed.
- Two interactive charts will show how the results change based on the data you enter.
- The first shows the policy's cash value and death benefit in relation to the accumulated loan (rate, term, indexation, etc.).
- The second shows the net value that will go to the estate for the insurance with the IRP strategy and the taxable investment held by the client
- Click the PDF button and the report will open as a PDF.
- A copy of the report is automatically saved in the /Downloads/Desjardins.
You can also save it manually.
- Go back to the Insured Retirement Plan input screen and click Exit.
You can only use the saved PDF copy of the report.
To present the strategy again, you'll need to create a new illustration and download it from the Strategies tab.